FHSU Athletics
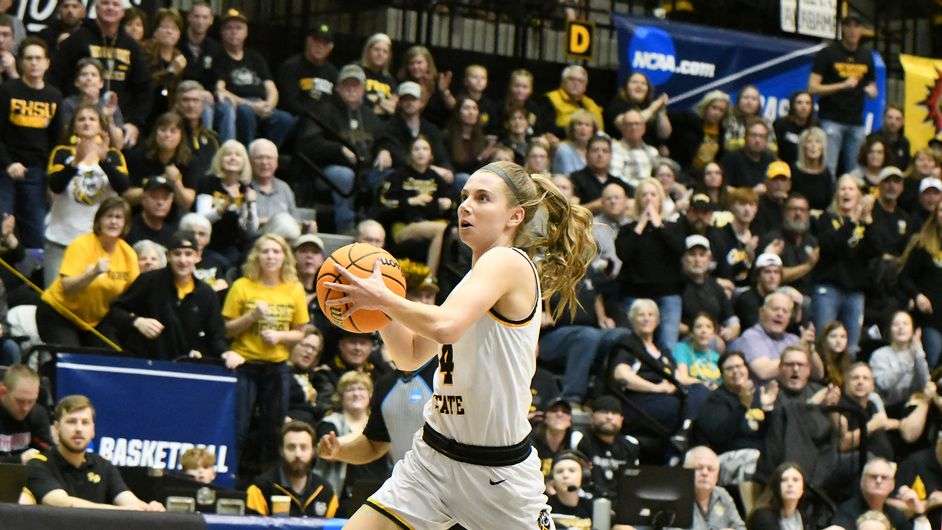
INDIANAPOLIS - The Fort Hays State women's basketball team led all NCAA Division II in both total home attendance and average home attendance for the 2021-22 season, announced this week by the NCAA office in the official 2021-22 attendance report. The Tigers averaged 2,184 fans across 18 home games, with a total of 39,315 fans crossing through the turnstiles at Gross Memorial Coliseum.
This is the 12th-consecutive time the Tigers have ranked in the top 10 nationally in average attendance, including seven years when FHSU ranked second in all DII women's basketball. Official attendance numbers were not tallied during the 2020-21 campaign due to the COVID-19 pandemic, but the Tigers ranked second in the country each of the six prior seasons.
Eight of the top 11 single-game attendance figures were recorded inside Gross Memorial Coliseum last year. That included a high of 3,575 at the NCAA Division II Central Region championship game, the second-best attended contest in all Division II last season.
Fort Hays State ranked first in the MIAA for the eighth time in a row, while the league as a whole led the nation in average attendance for the 13th report in a row dating back to 2008-09. Six conference rivals joined the Tigers in the top 25 in average attendance on the year.
The Tigers would have ranked in the top 50 in home attendance at the Division I level, slotting between Auburn (2,194 per home game) and North Carolina (2,136 per game).
The strong fan support has helped Fort Hays State create one of the strongest home-court advantages in the country, with FHSU winning nearly 92 percent of its home games over the last 10 seasons (148-13 since 2012-13). The Tigers are 189-30 at home during the Hobson era, good for a winning percentage of .863.
Fort Hays State is scheduled to play 15 home games during the 2022-23 regular season, including four non-conference matchups and 11 MIAA contests. Season tickets are currently available via TicketReturn, while single-game tickets will go on sale later this fall.
2021-22 NCAA Division II Home Average Attendance Leaders
Rank - School - Home Games - Total Attendance - Average Attendance
1. Fort Hays State - 18 - 39,315 - 2,184
2. Northern State - 13 - 25,568 - 1,967
3. Drury - 16 - 21,931 - 1,371
4. Emporia State - 14 - 15,506 - 1,108
5. Black Hills State - 11 - 12,085 - 1,099
6. Washburn - 15 - 15,906 - 1,060
7. Augustana (S.D.) - 14 - 14,325 - 1,023
8. Eastern New Mexico - 9 - 8,894 - 988
9. Southwest Minnesota State - 13 - 12,648 - 973
10. West Texas A&M - 20 - 19,269 - 963
11. Ashland -19 - 16,640 - 876
12. Lincoln (Pa.) - 15 - 12,311 - 821
13. Alaska Anchorage - 10 - 8,169 - 817
14. Winona State - 11 - 8,966 - 815
15. Pittsburg State - 15 - 12,146 - 810
16. Missouri Western - 16 - 12,917 - 807
17. CSU Pueblo - 15 - 11,803 - 787
18. Southern Indiana - 13 - 9,837 - 757
19. Central Missouri - 14 - 10,447 - 746
20. North Georgia - 19 - 13,396 - 705
21. Southwestern Oklahoma - 13 - 9,056 - 697
22. Missouri Southern State - 15 - 9,941 - 663
23. Ferris State - 13 - 8,604 - 662
24. Midwestern State - 13 - 8,586 - 660
25. Carson-Newman - 14 - 9,243 - 660
FHSU Average Attendance by Year
Year - Average Attendance - DII Rank - MIAA Rank
2021-22 - 2,184 - 1st - 1st
2019-20 - 2,296 - 2nd - 1st
2018-19 - 2,518 - 2nd - 1st
2017-18 - 2,053 - 2nd - 1st
2016-17 - 2,222 - 2nd - 1st
2015-16 - 2,293 - 2nd - 1st
2014-15 - 2,289 - 2nd - 1st
2013-14 - 1,851 - 3rd - 1st
2012-13 - 1,690 - 4th - 2nd
2011-12 - 1,736 - 7th - 3rd
2010-11 - 1,667 - 7th - 3rd
2009-10 - 2,214 - 2nd - 1st


